Opinion
Pre-pandemic trends that will shape the future philanthropic landscape in Australasia
by Siôn Lutley - 5 November 2020
Opinion
Pre-pandemic trends that will shape the future philanthropic landscape in Australasia
by Siôn Lutley - 5 November 2020
Siôn Lutley provides his interpretation of the messages behind the data from the CASE Support of Education Survey, Australia and New Zealand 2020 which was released last week.
It’s the eighth birthday for this survey – with its catchy acronym CSESANZ – and it’s the largest so far, both in the headline ‘New Funds Secured’ figure of $783m in 2019 and in the number of participating institutions (up from 26 to 33). The significant increases in both are very welcome, especially the much greater representation from New Zealand’s universities: it’s no longer the Australian and Auckland Survey!
Of course, any analysis of, or commentary on, this survey must begin by recognising that these figures come from a pre-COVID-19 era and the world has changed very significantly in a relatively short space of time. So, what, if anything, can we usefully gain from looking at this pre-pandemic data? In my view, quite a lot.
Although it may be some time before we find our way to the ‘new normal’, I believe that the underlying landscape and trends in philanthropy and giving to higher education institutions will remain and will re-establish themselves. The data from 2020, when it comes, will be an anomaly and, incidentally, may not be quite as bad as many fear or suspect. Several clients from the region have continued to fundraise very effectively during 2020, despite unprecedented times and significant pressure on budgets.
The news in brief
My aim in this blog is not simply to parrot the key findings or trends covered in the 2020 report but to highlight some new observations. However, for those who may not have read this year’s report yet, I’ve cherrypicked seven key findings here:
| 1. | The headline funds raised figure for 2019 of $783m is 24% higher than the total for the previous year, partly boosted by the increased number of participants but still up a healthy 15% like-for-like on 2018’s figure (i.e. comparing only those institutions that completed both years’ surveys) after the slight stumble in 2018, interrupting the long-term growth in funds raised. The non-Group of Eight (Go8) institutions prospered slightly more than the Go8s (17% vs 13%) – but more of this later. |
| 2. | This rate of growth was comparable with the overall increase in fundraising investment across the sector (14%), although this increased funding was mainly for the Go8s. |
| 3. | The growing contribution made by the largest gifts to the funds raised total continued. In 2019, there was a significant (37%) increase in $1m+ gifts but the majority of the 118 pledged $1m+ gifts were received by only four out of 33 universities. Six institutions reported receiving at least one gift of $10m+ and one reported a pledge of $50m (from a non-Go8 no less). |
| 4. | Despite the overall growth in funds raised and received, donor numbers fell. Even with an additional seven institutions participating in the survey, the report’s total number of donors fell from 67,462 to 64,764. Like-for-like, there was a 9% fall in donors on the previous year. |
| 5. | Alumni donor numbers fared even worse with an 11% like-for-like fall to compound the 6% fall the previous year. However, it was the Go8 universities that were hit hardest, having lost on average 24% of their alumni donors over the past two years – that’s significant! In comparison, the non-Go8 universities fared much better with alumni and non-alumni donor numbers actually increasing by 3% and 2% respectively. |
| 6. | Pledged gifts from Trusts and Foundations, including Public Ancillary Funds (PAFs), now make up a much greater proportion of giving – 45% of all funds raised up from 36% in 2018. This is more than just a result of the Paul Ramsay Foundation becoming more active. |
| 7. | Finally, after a bumper year for bequests in 2018, figures for bequest gifts dipped in 2019 with cash income from bequests falling 20%. This contrasted with bequest intentions, which rose strongly in 2019 by 36% after a poor showing the year before. Bequests still only account for approximately 6% of non-Go8’s cash income compared to a more substantial 13% for Go8s. |
It’s clear from these findings that there are three key long-term trends that are consistent with this year’s results:
The continued growth of philanthropy to Higher Education, with increased resourcing (for some at least);
The increased reliance on principal giving (for all universities, large and small);
There are fewer donors giving, but they are giving more on average.
However, there are two additional findings that I’d like to highlight that aren’t shown up in the report, possibly a result of the fact that the CSESANZ favours median averages, whereas I would argue that the mean better reflects performance across the sector groups.
More here than meets the eye
You’d be forgiven for assuming that the smaller, less-well-funded non-Go8 universities, lacking the various advantages of their older, more established Go8 brethren (including a depth of bequests) would deliver a lower rate of return – but if you did you’d be wrong!
In previous blogs, I’ve discussed the differences that exist between the performance of the Go8s and non-Go8 universities, with the non-Go8s narrowing the gap over the past few years and delivering much better rates of growth, while admittedly starting from a much lower base.
Historically, the larger and more established Go8s have raised the majority of all philanthropic gifts to HE in Australasia - not dissimilar to the Russell Group in the UK. They’ve done this through larger and better-funded Advancement programmes than the smaller but more numerous non-Go8s. The Go8s have traditionally operated at better rates of return and have attracted the lion’s share of both the $1m+ gifts and bequest income.
And some things haven’t changed – in 2019, the Go8s accounted for the majority (61%) of all new funds raised, over 70% of (non-bequest) $1m+ gifts and nearly 80% of total bequest income. The (mean) average funds raised for a Go8 university is still nearly five times as much as the average non-Go8 ($59.5m vs $12.3m).
However, the 2020 report marks another year of strong growth for non-Go8s (32% over two years) whereas Go8 universities have more modest two-year growth figures (5%) as they needed to recover from a 7% fall in 2018.
What’s even more impressive for the non-Go8s is the fact that they’ve managed this growth on minimal increases in fundraising investment (5% increase over two years) compared with a much more substantial 22% increase in investment in fundraising for the Go8s in 2019.
But, in 2019, when looking at the fundraising investment per dollar of new funds secured (using the headline data for the sector groups as a whole), non-Go8 universities produced a better mean rate of return than the Go8s, requiring only 13.9 cents to raise every $1 compared to 15.5 cents for the Go8s.
Are this year’s figures an anomaly, skewed by a couple of very large gifts to non-Go8s combined with fewer ‘mega-gifts’ to Go8s this year? Possibly!
This outcome did surprise me though so I did sense-check it with Stef Hardacre, one of the co-Chairs for the survey. She confirmed my findings and that they were the result of a skewing effect by a couple of outlier non-Go8 that had exceptional years. CASE uses a different methodology to calculate mean (using data not available publicly) but I’m comfortable using the sector-wide data.
Also, having reviewed two New Zealand universities recently, I’m guessing that the increased participation by institutions across the Tasman Sea will also have played a part in this shift, possibly a result of their “Number 8 wire mentality”.
So, this year may prove to be an exception, however, it’s true that the gap between Go8s and non-Go8s is closing.
A final point: does this mean that too much is being invested in Go8s? Personally, I take the view that this shows that increased resourcing in non-Go8s may well reap significant returns in additional income.
The changing face of giving in Australasia vs UK
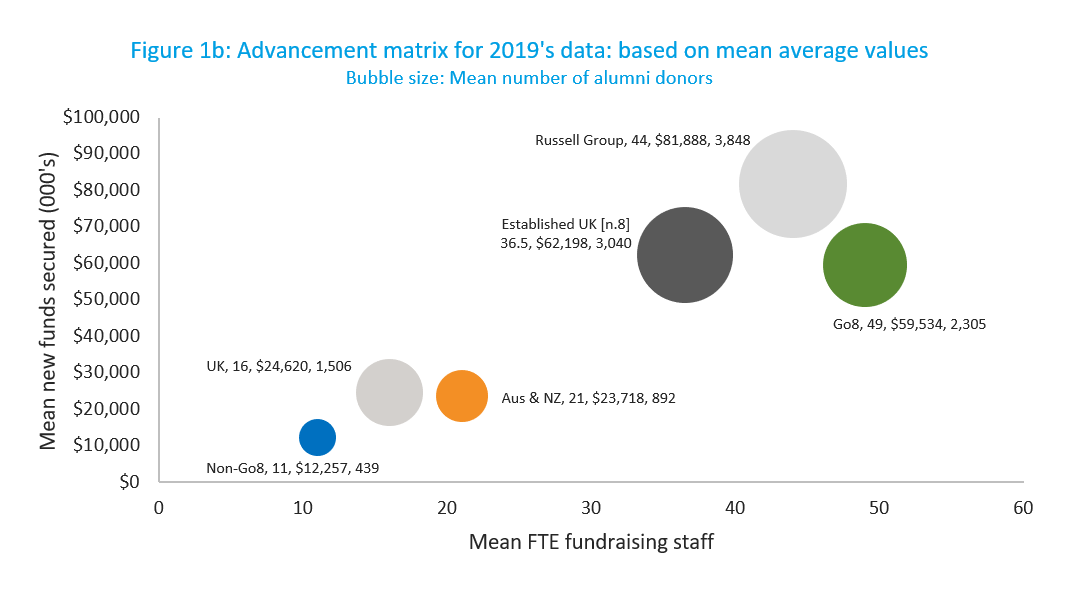
I thought it might be interesting to take a step back from this year’s data to look at how giving to Australian and New Zealand institutions has changed relative to their UK and Irish counterparts over the medium term. The two charts below are illuminating, comparing the data from 2016 with that from this year’s report.
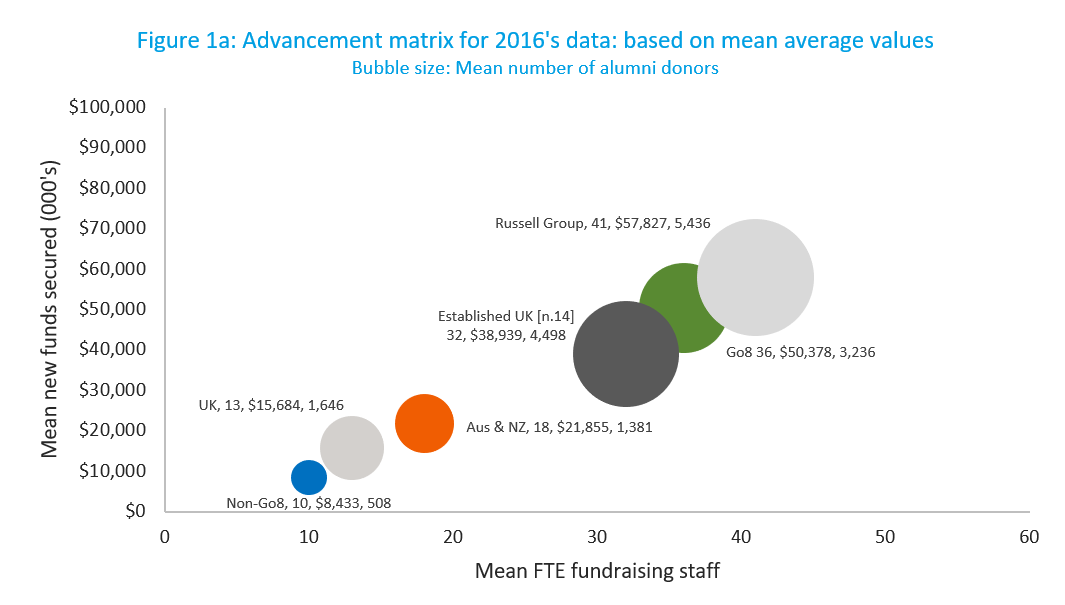
Now, I should point out a minor health warning that comes with any year-to-year comparison such as this. The universities participating, and the membership of CASE’s cluster groups, do change from year-to-year, for example, in 2017 there were 14 universities included in the ‘Established’ cluster compared to only eight in the 2020 report. Also the different exchange rates used are a factor (1.63 AUD:GBP for 2016 data and 1.83 for 2019’s).
Notwithstanding these couple of caveats, I’ve noted three key observations:
| 1. | The tide is rising – but not all boats are rising at the same rate. All groupings have improved over the three years, both in terms of funds raised and the size of fundraising teams. While, due to increased numbers of participants, it’s difficult to draw too many conclusions from the Non-Go8 and Aus & NZ groups, the Go8 group has been constant and we can see that the Go8’s fundraising teams, having grown 36% over the period, are now on average larger than the Russell Group’s. The funds raised by the Go8 also grew over this period, but by a lesser amount (18%). At first glance it looks as if the Russell Group’s growth outstripped the Go8 but if you remove Oxbridge, which has been the major factor behind the growth, then the remainder of the Russell Group only increased its income by 3.7% over the three years with a similar increase in their staffing. |
| 2. | Greater investment leads to greater return – but the rate of return is starting to vary. There has always been a clear and positive linear relationship between the number of fundraising staff employed by a university and the levels of new philanthropic funds raised – this isn’t new or surprising. However, what has changed is that, unlike in 2017 when the ratio between staff numbers and funds raised was similar for both Australasian and British/Irish universities (i.e. they followed a similar trend line), there is now a difference emerging in the rate of return for investment in fundraising between the leading universities in Australasia vs the UK. This difference becomes even clearer if you look at it in terms of the mean fundraising investment – I’ve used cents/A$ and pence/£ raised to remove any bias from exchange rate fluctuations (and used sector group totals to calculate averages): 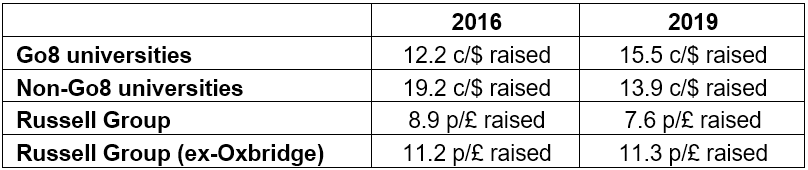 |
| 3. | The bubbles are shrinking. As stated previously, due to changing participation rates, it’s not possible to draw any hard conclusions from the data for some of the groupings but it is still clear that alumni donor numbers are, at best (i.e. for the non-Go8s), just about holding steady while for most, they’re falling, and not by small increments. Also, they’re falling by a greater percentage at the more established universities with the larger fundraising programmes and older alumni populations. For the Russell Group and Go8 (for which numbers can be compared) both have lost approximately 29% of their alumni donors over the three-year period. For the Go8 non-alumni donors, numbers have been holding up with small increases. |
Keep going...
The world which is presented in the 2020 CSESANZ is a very different world to the one we inhabit less than a year later. However, philanthropy does not stop – even for global pandemics! The past few months has demonstrated that, if your cause is compelling, donors still want to have an impact and will give. We have seen from previous (admittedly lesser) shocks, such as the global financial crisis in 2008, that they do little to disrupt the long-term trends. So, ignore these trends at your peril, better to learn from them and adapt.
University fundraising teams around the world have already started to adapt and innovate, often with reduced budgets. We will need to continue to learn new ways of engaging with potential donors while not forgetting the key trends that we’ve seen develop over the past few years – these trends will continue to shape the landscape for fundraising in the future.
There is still much to be optimistic about. I look forward to seeing how this innovation continues in 2021 and working with our clients to help them achieve their great ambitions.
As always, please get in touch if you’d like expert help to adapt to these changing times and thrive in them, or to dig deeper into the data in order to understand your own comparative position and how to strengthen it.
About the author
Siôn joined More Partnership in 2017, having previously been Executive Director of Advancement for the University of Melbourne and its A$1bn Believe campaign, the largest philanthropic campaign in the Asia-Pacific region. He is a former Chair and Faculty member of CASE's Asia Pacific Institute of Educational Fundraising (APIEF).