Opinion
Charitable Giving to Universities in Australia and New Zealand
by Siôn Lutley - 18 August 2017
Opinion
Charitable Giving to Universities in Australia and New Zealand
by Siôn Lutley - 18 August 2017
Siôn Lutley provides his interpretation of the messages behind the data from the 2017 CASE Charitable Giving to Universities in Australia and New Zealand Survey.
This week saw the release of the 2017 CASE Charitable Giving to Universities in Australia and New Zealand Survey (for which I’ll use the handy acronym CGANZ). It’s the fifth year this survey has been produced.
So, what does it tell us about the growth and health of philanthropic giving to tertiary education in Australia and New Zealand? I should emphasise that my aim is not to echo the many salient points made by Tim Dolan in his foreword – not least on the unwelcome changes to the 457 visa system and the challenges they have brought. However, some additional analysis of the figures indicates both positive, and potentially not-so-positive, trends in this year’s data.
First, despite the disappointing fact that it would be more accurately described as the Charitable Giving to Universities in Australia and Auckland Survey, as there was only one participant east of the Tasman, the report still gives a very good indication of the health of giving to institutions in Australasia. The CGANZ Report represents just under half (49%) of the institutions eligible to participate, which compares not that unfavourably against its much older British counterpart, the Ross-CASE survey, with its 64% participation rate.
A tale of two cities
I’m not saying that 2016 was the worst of times for the Group of Eight universities. It was far from that. But, as a group, total funds raised by the Go8 decreased by 3%, the number of confirmed $1m+ pledges fell by 9% and annual fund income declined by 13%. Yes, it’s true that cash received went up by 14% (largely as a result of previous years’ pledges) and overall donor numbers rose (just) – but 2016 was not the stellar year that 2015 had been.
However, the tale was very different for the non-Go8s. (I appreciate the risks in lumping all non-Go8s together in one group, but that’s the data we have). In fact, overall, non-Go8s had a great 2016 to follow up their even more impressive results in 2015. For example, the 2017 survey shows non-Go8s had bequest income up by 19%, annual fund income rose by 55% along with a 10% increase in the number of cash gifts over $1m.
Admittedly non-Go8s are starting from a much lower base with an average funds raised of $8.4m compared to the Go8’s average of $50.4m – a significant gap – but it’s wonderful to see such growth and strength across the wider sector.
Also, it should be highlighted and celebrated that, while 65% of donors to Go8s are alumni, the non-Go8 universities, with their smaller and mostly younger and less wealthy alumni populations, have been able to focus successfully on non-alumni donors. In contrast they have, on average, twice as many non-alumni donors as they have alumni donors.
The end of the good times for the Go8 or just a pause for breath?
The overall headline figure came as a bit of a surprise – at least to me – with total new funds raised lower in 2016 than 2015. This may have been by only 0.4% but still, at a time when overall investment in fundraising went up significantly (Group of Eight (Go8) universities by 11% and non-Go8s by 13%), this was counter-intuitive.
Admittedly, this result is off the back of a very impressive outcome in 2015, when funds raised were 27% higher than 2014. The two-year trend (2014-2016) shows an average increase of 13% per annum, which is a very clear indication of a healthy long-term growth in philanthropic giving to the sector.
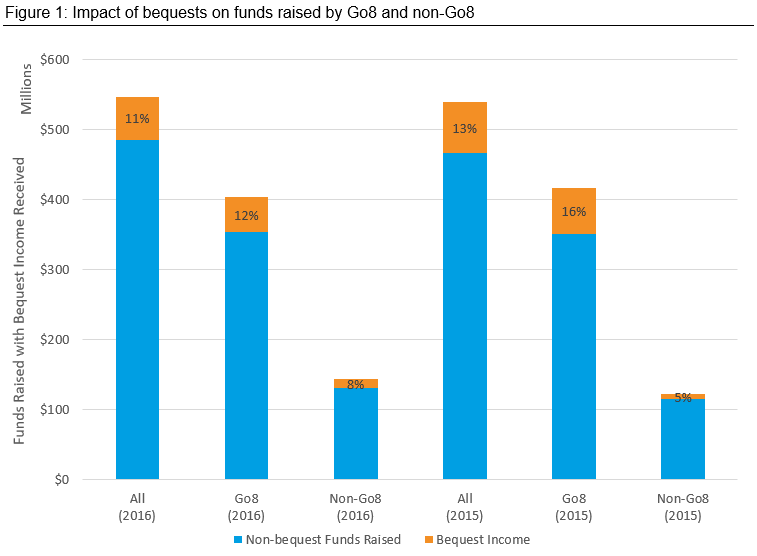
A major factor in the outstanding results in 2015 was bequest giving, with income a stunning 158% higher than in 2014. So, the dip of 33% in bequest cash income in 2016 shouldn’t have been that much of a surprise, and contributed significantly to the near-static level of funds raised. Ignore bequest income and even the Go8 group showed a modest increase in funds raised of 1% (see Figure 1 below) – slightly more optimistic than talking about a fall of 3%.
The key question is, therefore, was 2016 simply a period of consolidation for the Go8 before the good news of rapid growth continues, or was it the start of a period of lower (and perhaps more sustainable) growth after harvesting some of the low-hanging fruit? Only time will tell and, maybe, new campaigns will spur on better results.
Where are the campaigns?
2013 was a bumper year for campaigns Down Under with Sydney, Melbourne and then UWA all publicly launching their campaigns. A number of others were expected to follow suit in the subsequent years but, with the notable exceptions of Victoria University’s Centenary Campaign in 2015 and Auckland’s ‘For All Our Futures’ Campaign last year, there have been fewer announcements than expected.
Certainly, Sydney and Melbourne have both gone on to launch second phases of their Campaigns with Sydney recently surpassing its increased target of $750m. I should also add that you don’t need to be in campaign mode to raise serious amounts of philanthropic income (just ask Edinburgh’s Chris Cox!).
However campaigns, with the associated increase in focus on and resources for fundraising, do have a significant impact on funds raised. I look forward to seeing several Go8s and non-Go8s launching campaigns publicly over the next couple of years and will enjoy seeing the positive boost that they will bring to the sector as a whole. Any bets on which institution will be next out of the blocks?
Is it really true that the Go8 has outstripped the Russell Group and, that on average, Australasian universities are raising more than British universities?
Section 4 of the 2017 CGANZ Report has some very impressive charts that compare Australasian institutions with those in the UK. At first glance, it seems that the Go8 now raise more (with more fundraising staff and at a similar cost of fundraising) than their Russell Group counterparts.
More than that, it seems from the data that the overall Australasian average is greater than the UK average for all universities. Considering that the Australasian tertiary sector has been taking philanthropy seriously for only ten years (give or take) this is quite some achievement.
But, with my statistician’s hat on, I have to point out that the devil may be in the detail. The charts are based on the median not the mean, which is certainly one way of looking at it – just perhaps not the one that I feel is always the most revealing. If you compare the mean (see Figure 2 below) rather than the median then the Russell Group (including Oxbridge) raised an average of $57.8m (2015/16) compared with the Go8’s $50.4m (2016).
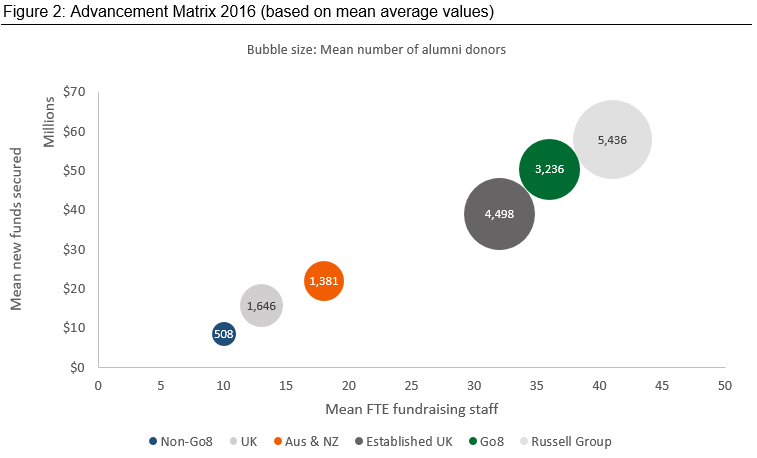
So, the Russell Group are still ahead on this measure, although not by much, and the question may be for how long? However, the Go8 are already ahead of the Established UK group that excludes Oxbridge.
The 109 UK universities had a mean average for funds raised of $15.7m (2015/16) compared with a $21.8m (2016) average for the 25 institutions in the CGANZ Survey. However, the Ross-CASE survey data includes a long ‘tail’ of institutions. If as hoped, the CGANZ Survey continues to increase its participation rate, this differential may disappear.
Regardless of mean or median, the huge strides made by Australasian universities in embedding philanthropy and establishing successful fundraising and alumni relations operations in a relatively short period of time is exceptionally impressive and a justifiable source of pride.
The march of the mega-gifts continues
Although the number of $1m+ donations raised by the Go8 fell from 2015 (54 gifts) to 2016 (49 gifts), it was noticeable that the mean largest gift raised by the Go8 universities almost doubled from $4.3m in 2015 to $7.9m in 2016. Notable gifts included the $35m donation from the Susan and Isaac Wakil Foundation to the University of Sydney and the $65m gift from Atlantic Philanthropies to the University of Melbourne.
It’s clear that the growth in major giving relied far more heavily on the $5m+ gifts than $1-5m gifts. Leadership/principal gifts at this level normally take much longer to cultivate and therefore require a longer-term approach and different strategy if universities are to be successful in this area with its massive potential.
Increasingly, universities have been relying upon these ‘mega’ gifts as a growing percentage of the funds they are raising and this looks set to continue in 2017 with the Jack Ma Foundation’s $26m donation to Newcastle and Andrew and Nicola Forrest’s record-breaking gift, (part of which went to UWA) continuing the trend. One thing is for certain, more of these mega-gifts will be announced before 2017 is over.
So, in closing, although the 2017 CGANZ Report may not be quite as impressive as the previous year’s results, it must be remembered that those were boosted by an exceptional year for bequest income. Thanks to a huge amount of work by dedicated staff and volunteers across many universities, growing numbers of donors are giving to Australasian universities, and not just to the largest and oldest.
There is much to celebrate and to be optimistic about. I look forward to seeing this growth continue in 2017 and working with our clients to help them achieve their great ambitions.
As always, any institution that would appreciate expert help in digging deeper into the data in order to understand their own comparative position and how to strengthen it is most welcome to get in touch with the More Partnership team.
Download
A PDF version of this blog, and other publications, is available for download in our Library.