Opinion
The news behind the numbers:
The Ross-CASE Survey 2016
by Adrian Beney and Joanna Motion - 4 May 2016
Opinion
The news behind the numbers:
The Ross-CASE Survey 2016
by Adrian Beney and Joanna Motion - 4 May 2016
What do the data and trends captured in this year’s survey of giving to UK universities really tell us – about the past, the present and the future of philanthropy in higher education? And where should fundraising professionals focus now? Here are our headlines – with some details to ponder for those at the sharp end.
Cause for Celebration
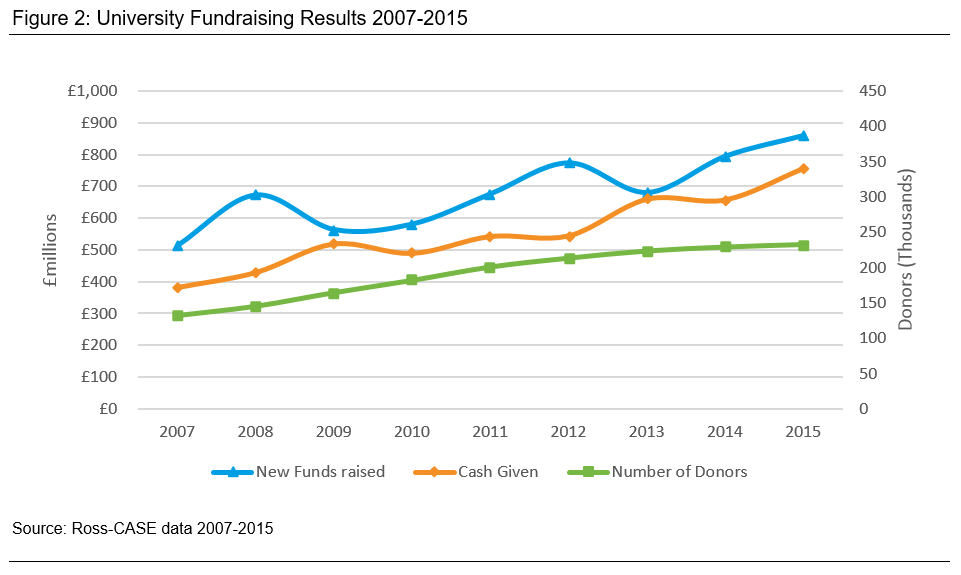
Very good news that the overall “Funds Raised” reached a record high of £860.9m – an 8% increase. Even better news is that the “Cash Received” line is more than keeping up. Indeed, analysis of results going back to 2007 shows that the cash received over that period is largely shadowing funds pledged. This means that the “Funds Raised” number has substance to it: pledges made are being fulfilled. As a result, there can be greater confidence in financial predictions; fewer noises off about smoke and mirrors.
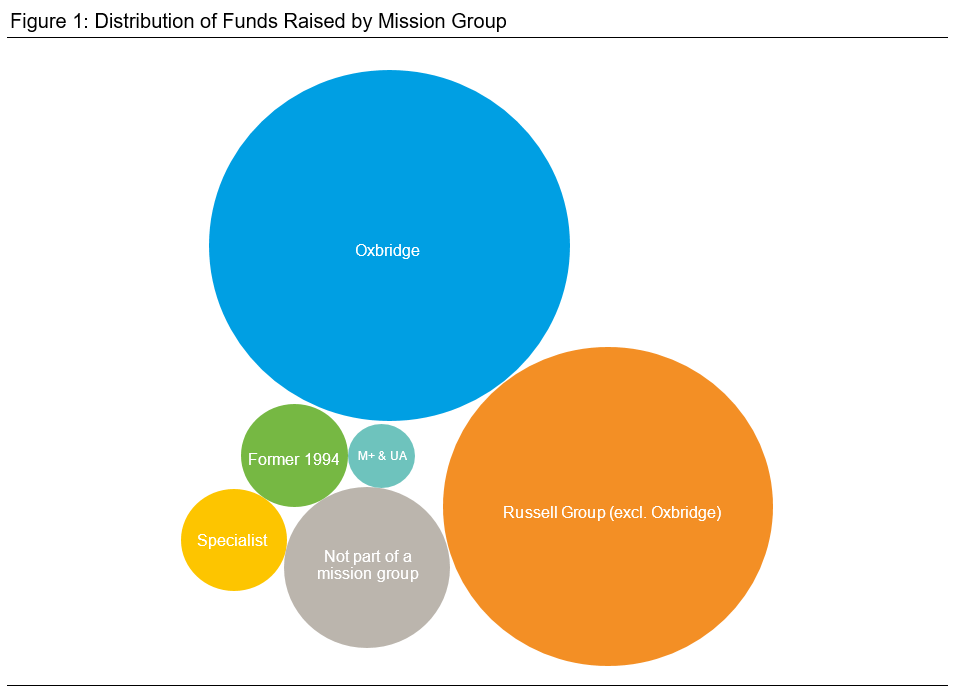
There is some seriously impressive fundraising going on. In particular, the ambitious, systematic and increasingly professional operations at Oxford and Cambridge demonstrate that giving to higher education of a kind we attribute to North America is now established in the UK. They show it can be done. Though some teeth will grind that Oxford and Cambridge are raising more than all the other Russell Group universities combined (and 44% of all the new money secured), there should be a general welcome for the increase in the number of institutions raising more than £10m per year (17 altogether). Beyond Oxbridge, the mean income from the rest of the Russell Group is now firmly over £10m per year, with a reducing dependence on just one outstanding gift each year to make the numbers. This suggests fundraising is becoming properly embedded in the institution and that the Development Office is large enough to be raising a stream of big gifts as well as the occasional, welcome, mega gift.
One area where all universities could sit up and take notice is legacy income. In the most recent year, bequests accounted for 13% of all cash received. Legacy income is up by 23% in 2015, following a rise of 25% in 2014. Interestingly, this significantly exceeds the 4.4% growth for a similar period experienced by the 76 high street charities that take part in the Legacy Monitor Consortium’s Legacy Foresight report. Universities are here for the long term. They are convincingly placed to be beneficiaries of legacy gifts and effective long-term stewards of a donor’s intentions. Their ability to change individual lives and to tackle the big issues facing society lend themselves to the extended planning horizon implied in the act of drawing up a will. A useful takeaway for Development Directors is to be sure they have done the analysis to understand their own relative performance in legacy fundraising.
Once again, giving from non-alumni is a substantial proportion of all individual giving (39%). This reflects universities’ increasing ability to fundraise for their cause, as opposed simply to trading on nostalgia and loyalty. The narrative is less about an obligation to give back and more about the excitement of giving forward.
The rise in Alumni Relations expenditure is a plus. We suspect this is closely related to the realisation that Alumni Relations is not just about party planning and after-sales service, but that it can be a real driver of progress towards key institutional goals. As our colleague Nik Miller says, “What keeps senior management awake at night? Student Recruitment? International collaboration? Graduate Employability? Institutional reputation? Engaging alumni strategically can aid restful sleep…”
The introduction in this year’s report of case studies from Bath, Bristol, Cambridge and Nottingham, also gives insightful key lessons.
Challenges
Compared with the acceleration in funds raised, the growth in donors has slowed frustratingly. Donor numbers have reached a high of 232,520, up by around 5% compared to two years ago (while alumni numbers have grown by 15.5%).
Of course most of the growth in absolute alumni numbers is among younger alumni, who will have graduated with a much higher level of debt than earlier generations. How will they behave as they mature? Puzzles such as these are explored through the detailed and painstaking evidence assembled in More Partnership’s award-winning Regular Giving Benchmarking project. For instance, we know that older alumni are more likely to give than younger ones. The question is whether the young alumni of today will change their philanthropic behaviour as they get older – or have we produced a generation (or two) of alumni whose increasing age will not incline them more to giving? What difference will social media and digital fundraising make? The sector doesn’t yet have the answers to questions of this kind, but we need to work towards them collectively.
To turn to the critical matter of the fundraising workforce: in the Pearce Report of 2012, commissioned by HEFCE from More Partnership, we noted the direct (and reassuring) correlation between investment in fundraising and the amount of money raised. In order for the target proposed in the Pearce Report of £2 billion a year to be raised by UK universities by 2022, the “Emerging Profession” of fundraisers in education needed to double, as More Partnership and Richmond Associates suggested in the follow-up report for HEFCE in 2014.
According to the latest Ross-CASE report, there are now 1,344 fundraisers among the 112 institutions participating in the survey. When we wrote the Pearce report there were 1,154 in 129 institutions. So that’s up by a third (per institution) since Pearce. But it’s still a long way to go. Where will we get all those extra fundraisers from? The ability to realise the philanthropic potential of the higher education sector remains scarily restricted by the difficulties of expanding this specialist workforce. Don’t put your daughter on the stage, Mrs Worthington: talk to her about the intellectual stimulus and satisfactions of educational fundraising instead!
How to get perspective on investment in fundraising? What returns are reasonable? There are two useful ways of measuring the scale of investment, while taking into account institutional size. One is to look at investment in fundraising as a proportion of institutional expenditure. The other is to look at the number of alumni per member of fundraising staff. The tables below draw on Ross-CASE results to view the data through those lenses.
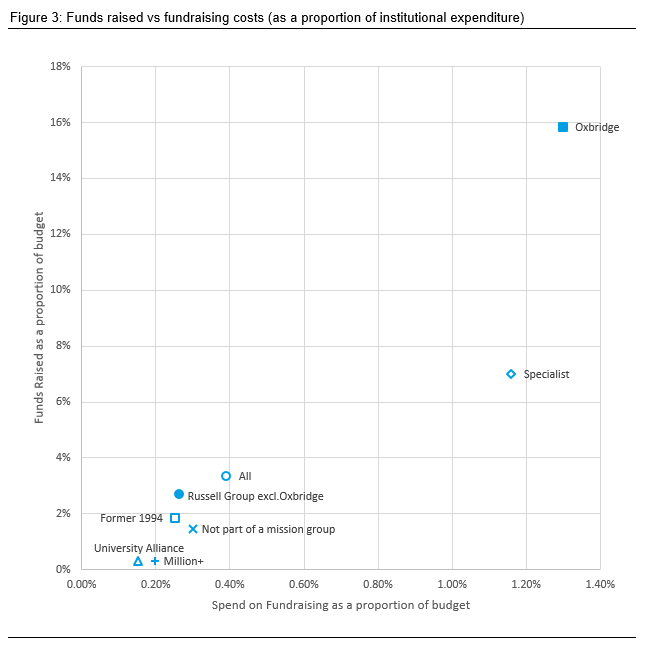
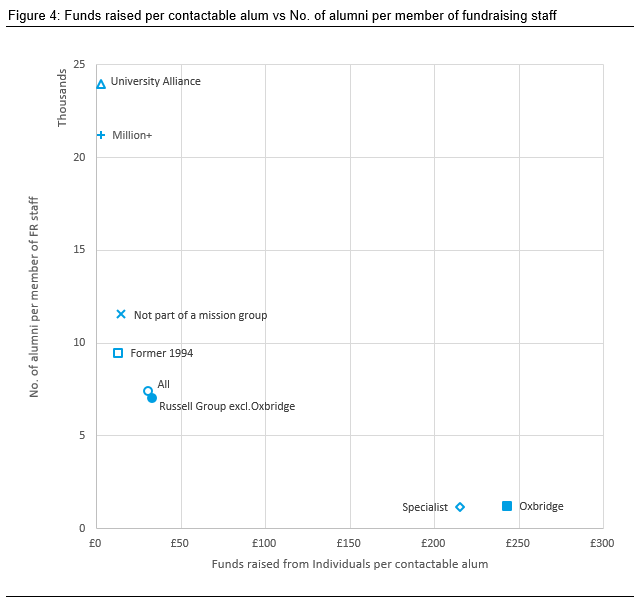
The evidence shows that those who spend more on fundraising as a proportion of their institutional budget raise more. And those who have fewer alumni per member of staff raise more money per addressable alum than those who have more.
Institutions tend to make return on investment a sacred beast, for obvious reasons. But a low fundraising cost per pound raised is a measure that may mean two things. It can reveal a balanced fundraising office working effectively. Or it can reveal an office in which one or two fundraisers are concentrating on the very largest potential donors with no time or investment to build the base of giving, and little emphasis on growing a sustainable stream of mid- to high-level gifts. Of course RoI is important, but we think that net return may be just as important – that is, overall funds raised less the cost of raising them. If investing £100,000 generated £1 million, while investing £150,000 generated £1.25 million, the return on investment would be lower in the second case. But the net return would be higher and the university would be better off.
This is all food for shared thought.
Considerations for the future
After 15 dogged years, the Ross-CASE survey is proving its worth. Externally it’s a valuable window on performance; internally it’s an invaluable discipline for fundraisers. As the editorial board reflect this summer on what changes would be helpful for the next phase, here are some suggestions:
Complexity is a deterrent to completion. It’s a pity that the number of institutions taking part has been going down as a proportion of those invited – from 83% of UK institutions in 2012–13 to 73% in 2014–15, a loss of 23 universities (including some with active development operations). This year’s questionnaire contained about 300 data points for the most recent year alone. Could the survey be simplified for those who only wish to complete the headline numbers?
That said, the sector is becoming more sophisticated. Almost all Advancement offices of any size have three broad areas of operation – Fundraising, Alumni Relations and Development Services or Operations. In many US institutions there are more staff in the “back office” than front line fundraisers and alumni relations staff. As fundraising becomes more expert and also more regulated, this role is already taking on increasing importance in the UK. Yet the Ross-CASE survey requires the staff numbers and investment in Development Operations to be split between Fundraising and Alumni Relations. This means that comparative analysis of investment in fundraising and alumni relations as separate activities is highly dependent on the manner in which individual institutions have allocated the Operations budget. It is time, we argue, to identify this expenditure in its own category, allowing much more reliable analysis of different areas of investment in Advancement.
And finally for now (geek alert!), we suggest a careful look at the use of Latent Cluster Analysis (LCA) in the report, or the way the LCA is being applied.
Ross-CASE presents an analysis of cluster against year of establishment of office. We reproduce this in our own format below:
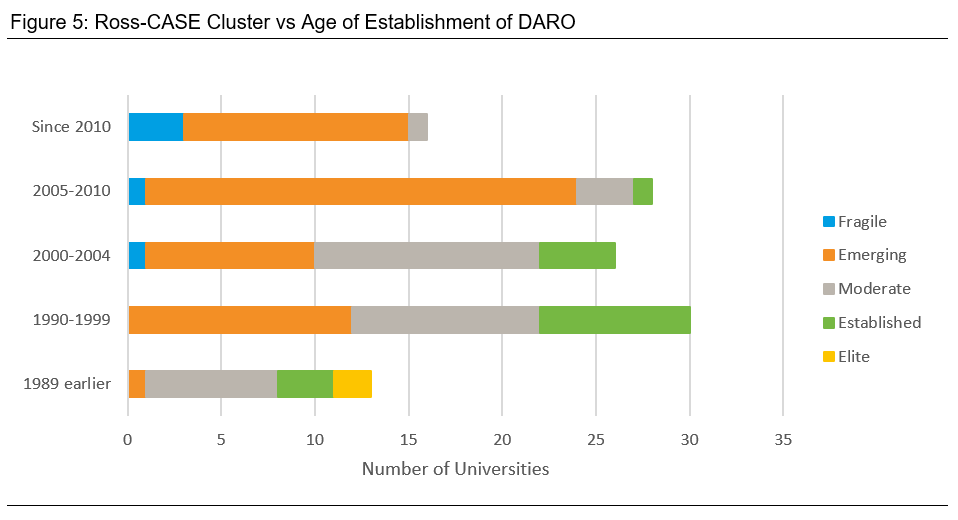
It is encouraging to see that one Development Office less than 10 years old has already reached the “Established” category, and a further three of this age are in the moderate stage. This shows what is possible. By contrast, it seems that 23 offices more than 10 years old are still at the “Emerging” or “Fragile” stage – serial start-ups, perhaps?
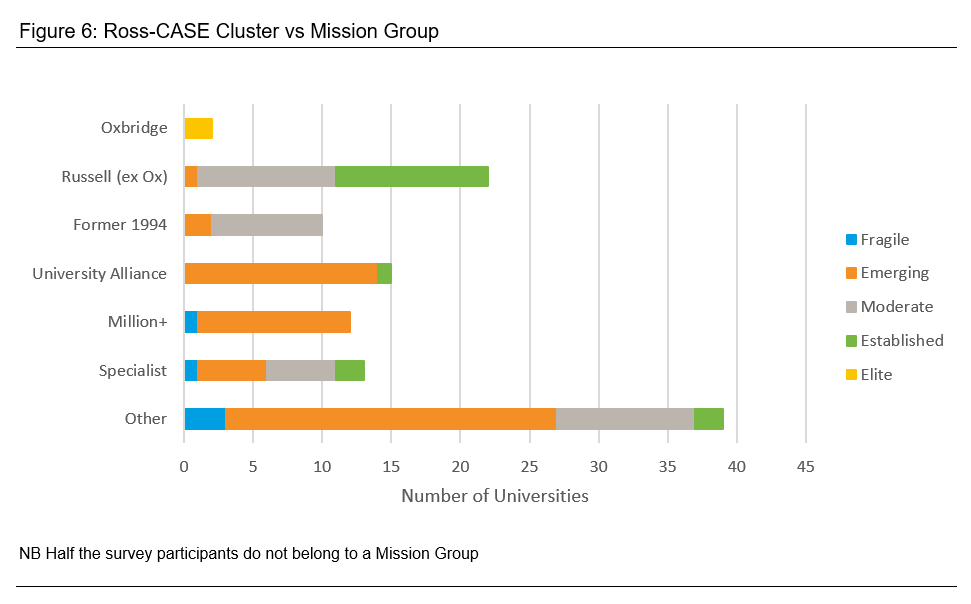
Individual Mission Groups are not necessarily a predictor of high performance either. Universities from the University Alliance, Specialist and “not in a mission group” all feature in the “Established” cluster. It is surprising, however, that one Russell Group university still appears in the “Emerging” category and concerning that no former 94 Group institution appears to have progressed beyond “Moderate”.
Fundraising can be challenging for the universities which used to be polytechnics and colleges of higher education. But we know from our own work with some of these that big gifts are possible, especially where the university can articulate clearly its mission and purpose. We dare to hope that more will be "promoted" to a more established cluster before too long.
What really lies behind these indicators? There may indeed be some under-performance that needs attention. But an alternative explanation is that the LCA is biased towards particular types of institution. We note that four of the seven measures used to drive the LCA have a high likelihood of being proportional to institutional size (cash income, new funds, number of donors and fundraising FTE). And that another measure, the proportion of alumni who are giving, correlates only moderately with overall fundraising success, as the Pearce Report showed.
This is worth getting right. The more robust the data and the clearer we can be about interpreting its meaning, the higher the tide of philanthropy to universities will continue to rise.
As always, any institution that would appreciate expert help in digging deeper into the data in order to understand their own comparative position and how to strengthen it is most welcome to get in touch with the More Partnership team.
A PDF version of this blog, and other publications, is available for download in our Library.