Opinion
The £1 billion milestone:
what really counts?
by Adrian Beney and Joanna Motion - 10 May 2017
Opinion
The £1 billion milestone:
what really counts?
by Adrian Beney and Joanna Motion - 10 May 2017
Adrian Beney and Joanna Motion provide their annual interpretation of the messages behind the numbers in the 2017 Ross-CASE survey.
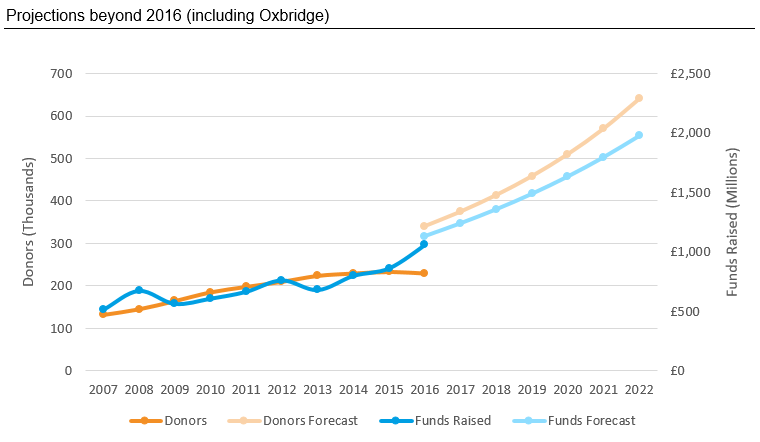
Five years ago, the Pearce Report reviewing philanthropy in UK Higher Education made some bold predictions. The More Partnership team, commissioned by HEFCE to research and write the Report, looked ahead ten years to the likely state of Development (fundraising and alumni relations) by 2022. At the half way point on that pathway, how is the sector measuring up to the big goals we set ourselves?
How are we doing?
In 2012, we wrote: “if the trajectory in growth in giving of the past ten years were to be sustained over the next ten, then there is potential to reach £2 billion per annum by 2022 from some 640,000 donors”. Well, the acceleration powers on. As Professor Sir David Greenaway of the University of Nottingham points out, universities are now raising in one year what used to take five years. The invigorating headline from this year’s Ross-CASE Report is that we crossed an important psychological threshold this year: over £1 billion in new funds raised was recorded within UK higher education. That’s a big number in anyone’s book. Cause for real celebration. And at half way to the 2022 goal, we are almost where we hoped we’d be on funds raised. We are lagging quite a way behind on donor numbers, however.
Who is making the running? No surprise that Oxford and Cambridge have become philanthropic powerhouses. Each has an ambitious and high profile campaign under way, Oxford Thinking in the dark blue corner, Dear World from the light blues. Their professional and focused work lifts sights for everyone.
What’s more notable this year is that the increase in new funds raised from everyone else amounts to £102 million, or 27% up on the previous year. This growth is surely encouraging news. We know we have some ambitious and innovative development offices within the rest of the Russell Group: engine rooms for confidence and expertise in philanthropy across the sector. But institutions beyond the Russell Group raised 30% more in 2016 than they had in 2015, up from £160 million to £207 million. That’s a faster growth rate than either the ex-Oxbridge Russell Group or Oxbridge itself. That is encouraging for HEIs with varying missions, history and scale.
What's with the donors?
But as our chart shows, we’re not on track in parallel with the increase in numbers of donors. The other significant trend in this year’s Ross-CASE report is that, after several years of reliable improvement, donor numbers have stumbled. Overall, they are down by 1.5%. This drop masks contrasting underlying patterns. Oxbridge was up by 2.7%, other Russell Group donor numbers are down by 3.8% while the rest are down by 3.1% (albeit with three institutions reporting in 2015 that did not report in 2016).
That donor numbers can fall in a year when the money is breaking records underlines the dominance of major (and now mega) gifts – always a strength for higher education – as the annual Coutts Report into £1 million gifts explains. But it also suggests some self-censorship by fundraisers. This is the first full Ross-CASE year following the Daily Mail’s exposé of poor fundraising practice in some charities. Despite no suggestion that the higher education sector had engaged in poor practice, this has sent the same ripples of uncertainty through university development offices as much as across the third sector more generally.
We know from More Partnership’s Regular Giving Benchmarking programme – involving 13 institutions and drawing on 50 million lines of data on gifts below £10,000 – that some universities have taken an overly risk-averse approach to telephone fundraising since the Daily Mail revelations and the regulatory approach this has provoked. Some universities have cut telephone fundraising altogether, and others have decided not to make (entirely legal) calls to alumni registered on the Telephone Preference Service for whom they, in fact, have consent. This caution is taking its toll. Falls in regular giving income might well be compensated for by the impact of high end gifts. But this does not replace either the often-unrestricted funds given in these programmes, or the work they do to identify and direct supporters who may be ready to enter a major gifts programme. Warning lights flashing here for the future…
More regulatory impact?
Will next year’s survey show more of the same? It is only in the last 10 months or so that the newly assertive Information Commissioner has been arguing that, without formal consent, updating addresses and doing wealth screening is unfair and hence unlawful. The ICO has also argued that only very limited research using publicly available data can be carried out without consent. CASE is in the process of commissioning research to find out what university supporters actually think, since there’s plenty of anecdotal evidence that, in a university supporter population, few people are surprised or feel these practices are intrusive. But for now, the ICO’s unevidenced approach risks further overreaction by cautious fundraising offices and/or compliance staff.
Tooling up
The Ross-CASE survey is an increasingly valuable instrument to help fine-tune philanthropic performance. Among the cluster groups, the split of Emerging operations into Emerging and Developing is a welcome addition. The new table suggesting characteristics for each cluster will be helpful and thought-provoking for Development staff.
The dependence on a small number of gifts – one of the indicators that underlines progression through the steps of the cluster groups – is a key factor for the sustainability of fundraising and alumni relations programmes. The Emerging band appear to be one step ahead of the Fragile institutions but they rely on just one gift for 44% of their new funds raised. This dependence drops to 29% for the Developing cluster, which is one percentage point lower than for the Established. We still have some concern about the extent to which these clusters are dependent on institution size: four of the seven measures used to determine the clusters are unmoderated by any factor that considers the scale of the organisation. It would be interesting if CASE were to develop an alternative, or parallel, clustering system which factors out size.
Mission Group analysis
It could be argued that the division of universities and other HEIs into Mission Groups is less statistically significant than the cluster analysis. However, Mission Group data is still useful for the following reason: the clusters tell us what’s been happening irrespective of the nature and purpose of the university – albeit moderated by size. The Mission Group data tells us about fundraising in universities of similar “mission” and purpose – who they want to be. And we know that “mission” and “who we want to be” are very important in most aspects of fundraising. So, what do we see in the Mission Group data?
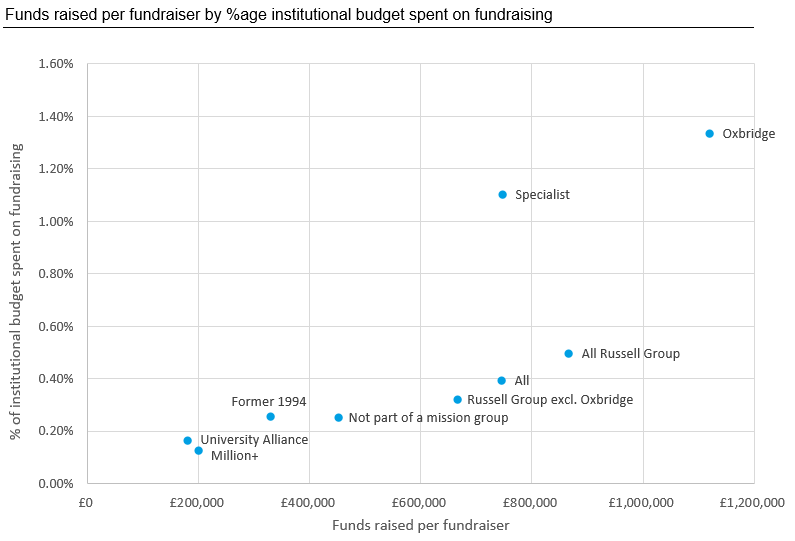
As a proportion of institutional expenditure, the former 1994 group continues to spend 20% less than the Russell Group on its fundraising operations. Drilling into the figures we actually find that fundraising staff expenditure is only 10% less than in the Russell Group, but non-staff expenditure is 45% less. Is the former 1994 group recruiting the fundraisers but not giving them the budget to do their job? The following two charts show comparisons in Mission Groups between the new funds raised per head of fundraising staff and:
the institutional spend on fundraising as a proportion of overall turnover; and
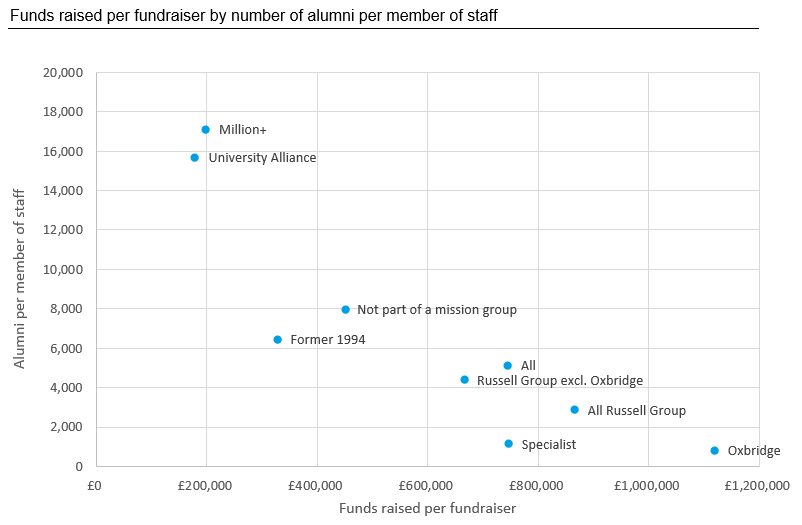
the number of alumni per head of fundraising and alumni relations staff. This is a crude (but effective) proxy for the extent to which a Development Office can personalise its interaction with its supporter and potential supporter base.
In each of these two charts we can see that investment and return are strongly correlated. This doesn’t tell us that one will automatically follow the other, and we know that some groups of institutions will almost always find it harder to fundraise than others. But they do show that lower investment is not only correlated with lower returns, but it is also correlated with lower efficiency. This underlines what we said in the Pearce Report that it is not enough simply to hire a few people – they need to be able to work in a context set up for success, with adequate support and infrastructure to make the most of the investment that is being made in fundraising and alumni relations.
Impact
Finally for now, the survey's case studies tell a strong story. It’s easy to get entranced by the numbers. But what really counts is what happens as a result. The research into dementia. The new scholarships that break down barriers to access in education. The innovations that improve the way society works. And a growing culture of philanthropy among thousands of donors who see higher education as the most effective place to advance such important work.
As always, any institution that would appreciate expert help in understanding their own comparative position and how to strengthen it is most welcome to get in touch with the More Partnership team.
Onward to the next five years…