More Partnership’s Insight team roll up their sleeves and don the green eye shades when the annual Ross-CASE survey of giving to UK universities is released.
Ever since the Pearce Report of 2012, for which we did the research and analysis, we’ve taken an acute interest in both past performance and future trends.
With the caveat that we can delve deeper now that comparable trends data have been released by CASE, here are our initial thoughts on what to watch out for...
Overall funds raised, cash in and donor numbers look like this for the last few years:
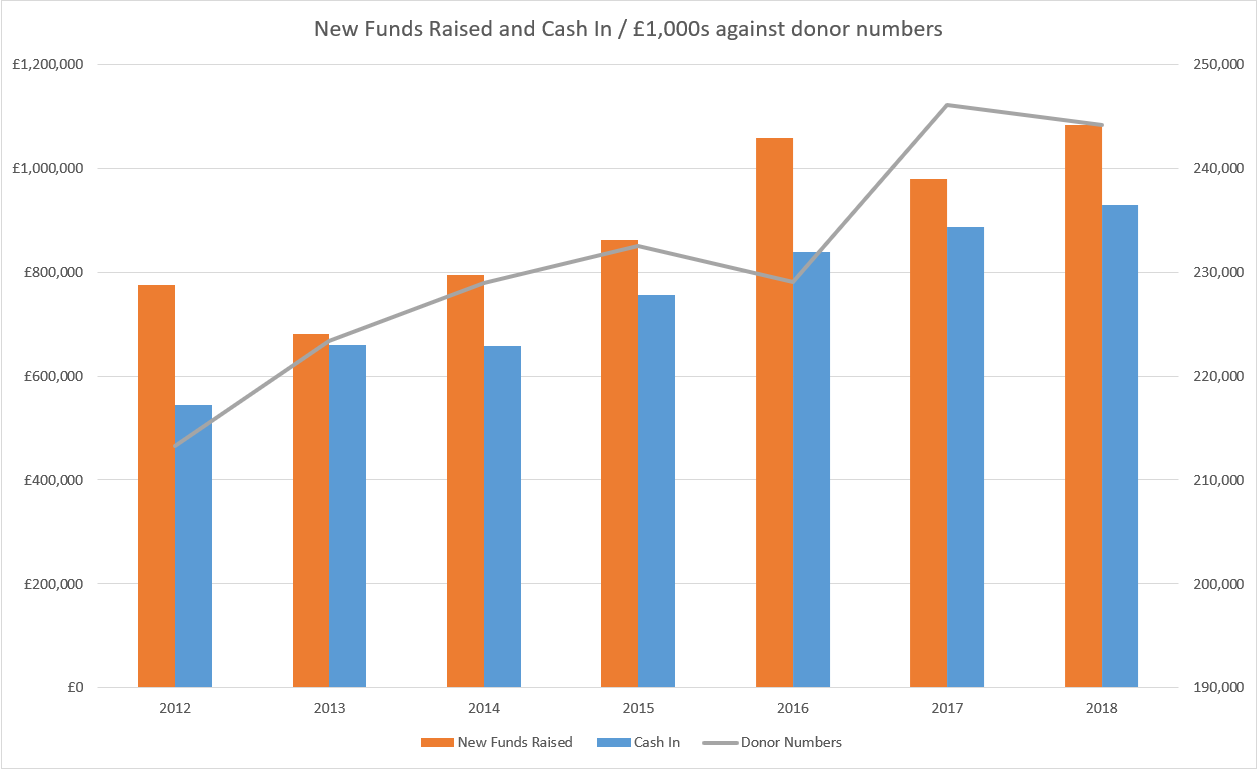
This chart shows totals from each year's survey rather than the totals for those that have taken part in every year. Thus some years will contain more reporting institutions than others. However, since Oxbridge and almost all of the Russell Group have taken part in each year for which data is presented, the resulting error is likely to be less than +/- £10m. This error does not change the interpretation of the data.
We know from our own Regular Giving Benchmarking project, in which more than 35 universities have taken part since 2010 that, although income is mostly on the up, some of the most established regular giving programmes are slowing down in the recruitment of new donors, with a rise in gift sizes being more common in younger programmes. It is indeed an international pattern that donors are lifting in quality while they are falling a little in quantity.
There are some supernova gifts out there – very high quality indeed. They make amazing things happen, but they can distort the overall picture. This year, the largest gift recorded appears to represent more than three-quarters of the increase in new funds raised, for instance.
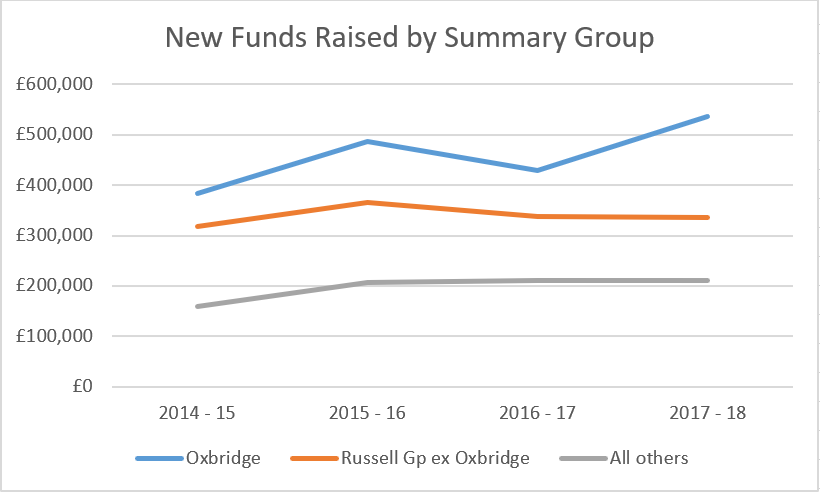
A small group of the 100 institutions that took part in the survey make most of the running. The ambitious teams at Oxford and Cambridge raised 50% of this year’s money and the next 32 HEIs accounted for the next 34% or so. Are some programmes (beyond Oxbridge) flat-lining now? We know from our work down under that the Australian Group of Eight research-intensive universities, led by Melbourne and Sydney, are snapping hard at the heels of the UK Russell Group (even including Oxford and Cambridge) in terms of average philanthropic achievement.
So where are the opportunities for improved performance?
Congratulations once again to the “specialist” institutions (a category likely to include, for instance, the Courtauld, London Business School, the Royal College of Art, the Institute for Cancer Research and the Royal Academy of Music). They use their ability to focus on a tight range of causes (and their greater hunger for philanthropic funds?) to good effect, and with an impressive Return on Investment.
This interesting chart shows the split between sources of gifts by different bands of HEI, using the “Pearce groups” based on age of foundation:
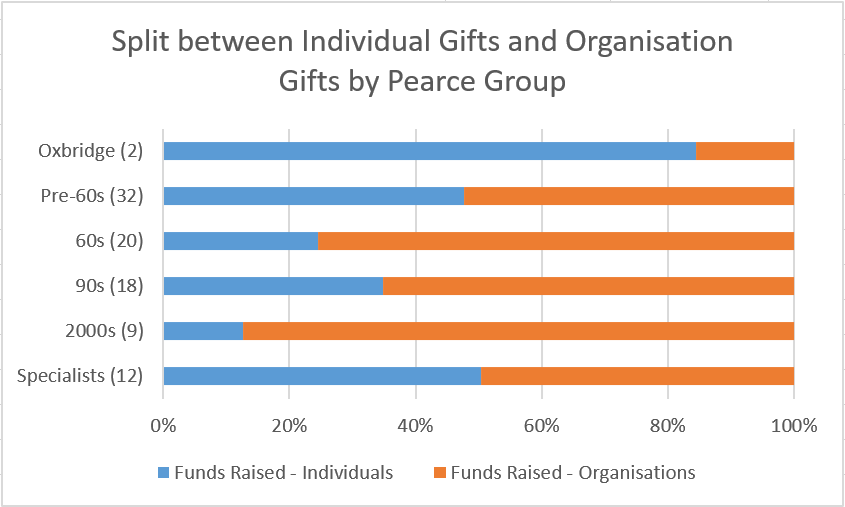
Worth exploring the notion that, the more sophisticated your Advancement operation becomes, the more it opens up the ability to talk to individual donors, with appropriate staffing to support high-level conversations?
There is opportunity, we reckon, for more individual major gift fundraising beyond the usual suspect institutions. Everyone should be working harder at legacy fundraising. On the face of it, alumni participation is a source of gloom, but we know from our Regular Giving Benchmarking project that some within the pre-1960s group have more than three times the average proportion giving. It reflects relatively low investment in Alumni Relations both in general and in regular giving activity. And yet these areas are not only a pipeline for volunteers to help with student recruitment, employability and advocacy but also for major gifts and legacies.
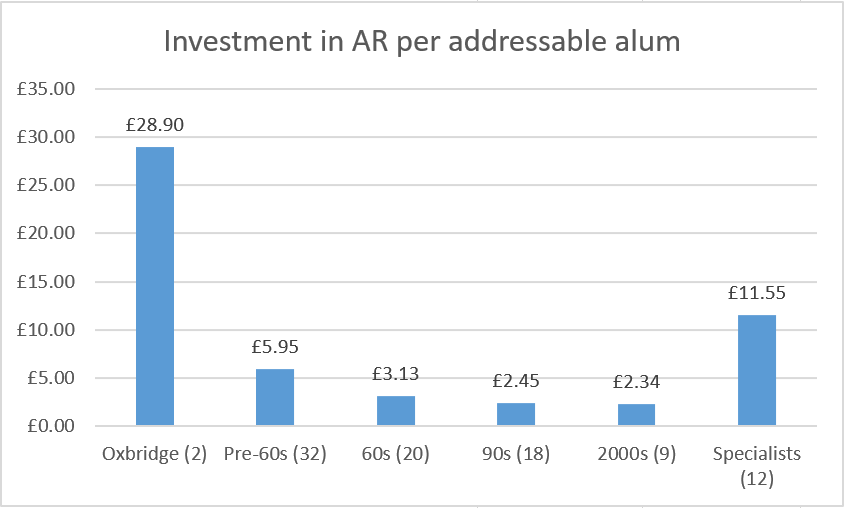
It’s noticeable that the pre-60s HEIs are investing nearly twice as much as the 60s group, and the post-92 institutions just 80% of that. Hardly surprising if we then see a correlation with alumni engagement.
A further source for concern is the tailing off in participation in undertaking the survey. It’s an indicator of the overall philanthropic health of the sector that Advancement offices have the ability and the commitment to be accountable for their numbers.
And finally for now, for those who track the tracking, we’ve updated the chart we first produced for the Pearce Report, showing the forward trends required to reach by 2022 the sector’s goals for philanthropic revenue and donor numbers. The absolute accuracy of this chart is a little subject to the ups and down of participation in the survey itself, but most of those raising the most, and acquiring the most donors are represented in each year of data.
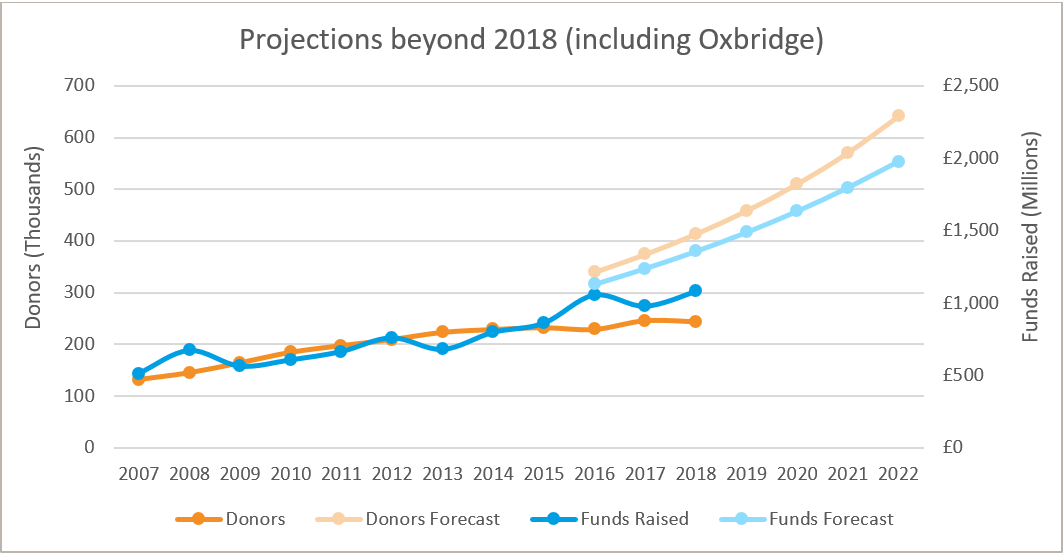
On and up it is. But a bit more oomph would be welcome.
As ever, if you would like help in delving into the numbers and identifying what your institution can do to improve performance, we’d be delighted to hear from you.