Opinion
Ross-CASE survey 2013/14:
Getting the data to sing
by Joanna Motion - 01 May 2015
Getting the data to sing: an analysis of the latest fundraising benchmarking results from UK universities - the Ross CASE Survey 2013/14
Big gifts hit the headlines. They may be the £325,000 legacy bequeathed for bursaries at George Watson’s College in Edinburgh by a revered school teacher. Or the latest gift from Lord Paul – this time £1m to enhance the student experience – at the University of Wolverhampton. Or the remarkable £30m from Paul Marshall to found an Institute of Philanthropy and Social Entrepreneurship at LSE.
Do these spectacular swallows make a philanthropic summer, though? Gradually, the increasing professionalism of fundraisers in education is being underpinned and demonstrated by the availability of convincing data. Evidence gives fundraisers both focus and confidence. Among the contributors to the evidence base is More Partnership’s Regular Giving Benchmarking programme, the largest and most data-intensive analysis of alumni giving anywhere in Europe. Headlines from this year’s results will be unpacked shortly in a blog from our associate, Rosie Dale.
And then there’s the annual Ross-CASE survey, which has patiently gathered information since 2002 on the revenue and costs of philanthropy to universities in the UK. The Report for 2013-14 is now out , with information on 122 institutions. Excellent that two each from Ireland and the Netherlands signed up this time (a welcome expansion of geography). A shame that 17 institutions have dropped out: being accountable to donors and to the sector is part of the responsible behaviour that will fuel future philanthropy.
More drew heavily on Ross-CASE data when researching the Pearce Report for the Higher Education Funding Council for England in 2012 and again for last year’s follow-up report on the fundraising workforce (written with Richmond Associates), An Emerging Profession. So we pay the exercise careful attention.
Here are key pointers from the latest numbers from our point of view – good news, yes, but also some areas of concern and some requiring greater scrutiny.
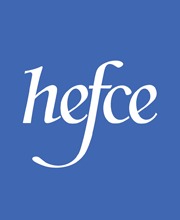
The key lines on the graph are pointing the right way. Last year we asked if the dip in new funds raised was a blip or a bloop. This year’s numbers encourage us to think it may just have been a blip. Overall funds raised, at £807m, are substantially up on the previous year. More importantly, they are 6% more than the peak of 2011-12. Cash received has stalled, but not gone down, and probably represents the result of the lower “funds raised” result in 2012-13.
Donor numbers overall continue to rise steadily. On the face of it, this is particularly good news, indicating that it’s becoming increasingly normal for alumni to support their alma mater.
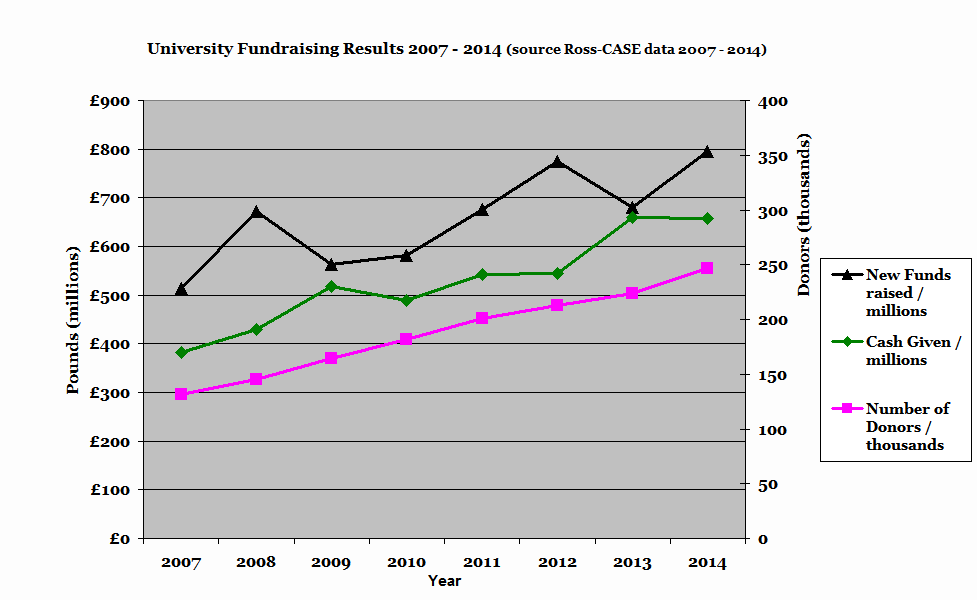
At second glance, however, on the basis of the aggregate data supplied so far in the report, we suspect the recent growth is accounted for by progress at the top end – that numbers of gifts to Oxford and Cambridge have climbed while the average of the rest almost flatlined. Even allowing for the one Russell Group university that did not participate this year, our initial analysis suggests that Oxbridge accounts for over 80% of the growth in donor numbers since 2012 (alumni and non-alumni.) It would be illuminating if the report would show the longer term funds raised, cash-in and donor number charts with and without Oxbridge, so we know how good the news is. Our shot at the aggregate numbers, including Oxbridge, is below, based on published data from Ross-CASE surveys over the years.
Given that we know from the Pearce Report that fundraising success strongly correlates with the size of the workforce, it’s helpful that fundraising staff numbers are up by 13% in the same period.
A cause for real celebration is the 10% increase in funds given by staff, now a total of £10.6m. That’s a great vote of confidence in the mission of their institution, accelerated, no doubt, by such initiatives as Nottingham’s Life Cycle series.
So far, so good. But is it good enough to meet the targets for the sector set out in the Pearce Report? Are we on track to reach £2 billion of income a year from 640,000 donors by 2022? Not quite. That slip in funds raised last year has set progress back by 12 – 24 months.
As for alumni participation in giving – a standard health indicator in the US (and one that has been steadily declining there) – there’s the good news and the frustrating news. The fact that the participation rate has been maintained overall is in one sense encouraging, because the number of addressable alumni has risen by 15% in the survey period, and most of those are young and perhaps not yet in a position to give much. So alumni and development staff are running harder to stay on the same spot. But the fact that the spot is as low as 2.1% participation remains sobering (our Regular Giving Benchmarking project, however, has revealed interesting trends in participation by age and affinity – more in a blog to come…)
By every measure, Oxford and Cambridge dominate the philanthropic landscape (and their alumni participation rate at 15.6% is twice the median for US public research universities). But, notably, they are not drawing away from the pack. Instead, the proportion of funds raised by the other members of the Russell Group of universities is climbing healthily; it’s encouraging that the latter group’s median amount raised is over £9m; the cost per pound raised within “established” members of the Russell Group is drawing closer to the efficiencies of Oxbridge as well. And the increase in the number of institutions raising £10m or more is heartening (16, up from 9). £10m is a chunk of change, after all.
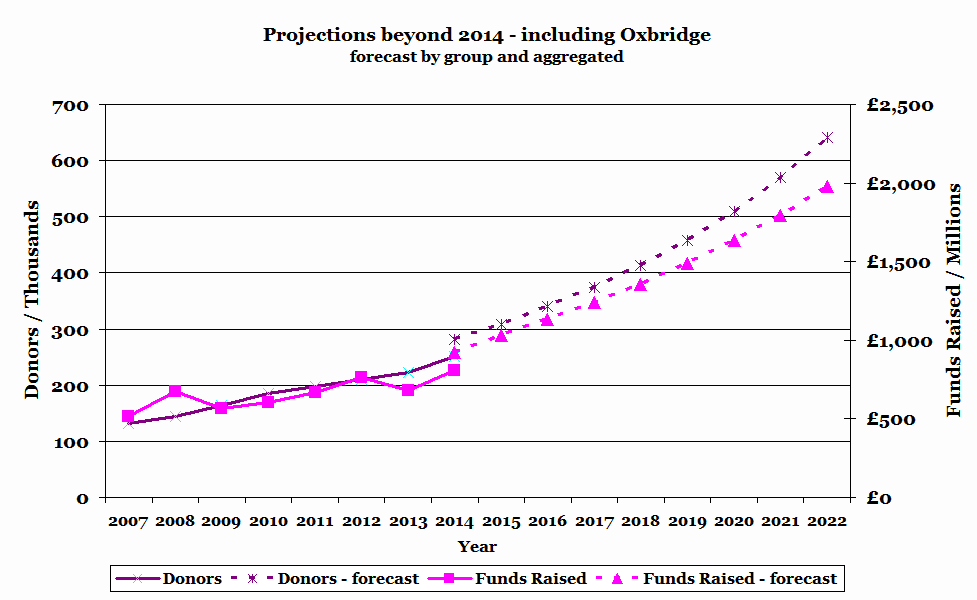
There are thought-provoking differences between the Russell Group (excluding Oxbridge) and the members of the former 94 Group. A comparison shows that the former raised a mean of £675,000 per member of staff. The comparable figure in the ex-94 Group was only 14% less, a figure that could well be ascribed to the greater likelihood of a Russell Group university having a medical school. So why is the average Russell Group university raising four times as much as an ex-94 Group one? Part of the answer has to be that the median Russell Group (excluding Oxbridge) university has 22 fundraising staff, whereas the median ex-94 Group office has just six. Of course there are matters of scale – Russell Group universities tend to be larger and with more alumni therefore. But the fact remains that with fewer fundraisers, smaller amounts of money are raised. A case for greater investment in the successful teams in ex-94 group institutions?
There is a wide discrepancy between the amount of money raised per fundraiser in the Million+ and University Alliance groups when compared with the other groups.Many factors will contribute to the disparity, among them internal fundraising expectations, staff experience and alumni wealth. But when the fundraising is going well, in our view there will be clear articulation of an appropriate Case for Support that is aspirational but realistic. The Pearce Report made some suggestions about what a successful fundraising establishment might look like in these universities.
It’s worth noting that expenditure per head of alumni on alumni relations activity appears identical in real terms to that of 2011-12’s report, and 10% lower in real terms than last year. With the growing emphasis on alumni relations as playing a strategic role in student recruitment, employability and international relations as well as fundraising, this may merit some attention.
For future and further scrutiny: why is giving by companies down, both in absolute terms and as a proportion of overall giving? And which Vice-Chancellors should be pleased and which concerned?
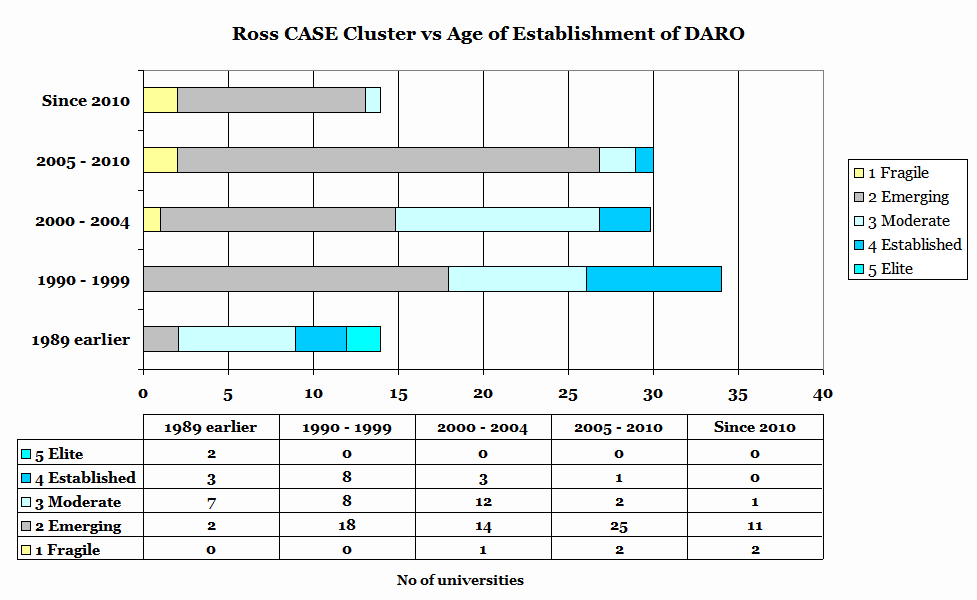
The survey uses a “cluster analysis” method to group institutions with similar fundraising behaviour together.The idea is a good one. But we think the model used may over-emphasise success in larger institutions since two of the seven factors (“average number of donors over 3 years” and “average number of staff over 3 years”) are likely to depend on institution size. Since the cluster names stress the extent to which Development is a core institutional activity, we have compared the clusters with the age of establishment of the Development operation.
The comparison produces some warning signs and some things to celebrate.
There are 20 universities with Development Offices at least 15 years old that are still classified as “emerging.”Two of them are more than 25 years old. If the title of the cluster is a fair one, then attention needs to be paid to this.
Much more encouragingly, one office established between five and ten years ago is already in the “established” category, and three more are “moderate.”
Producing this kind of survey is a challenge for those who collect, aggregate and analyse the data. Respecting the privacy of those who submit data makes writing an informative public report very much harder. The analysis on clusters, mission groups and on sources of giving gives us tantalising glimpses of the richness that underlies this dataset. (We regret that this year NatCen has dropped the age-based Pearce categories that we created and found very useful, not least because many institutions with an interesting philanthropic story to tell, such as The Open University, the Courtauld Institute and the University of Aberdeen, do not belong to Mission Groups.)
Yet without digging more deeply into the data, the public report will always be a somewhat simplistic document. Happily, the survey provides a benchmarking tool to its participants that allows them to understand the substance behind the headlines. For those who do not have the time or the expertise to get the most out of this data, More Partnership has the experience, the analytics and the track record to draw instructive conclusions both for individual institutions and for benchmarking groups. Data works hardest when it’s made not just to talk but to sing.