Opinion
2025 CASE Insights Report: good news for many and lessons for all
by Adrian Beney - 11 September 2025
Opinion
2025 CASE Insights Report: good news for many and lessons for all
by Adrian Beney - 11 September 2025
The 2025 report from the Council for Advancement and Support of Education (CASE) on fundraising performance at UK and Irish Higher Education Institutions was published recently: let’s take a look at the takeaways and trends over the academic year 2023-24. This assessment provides an insightful backdrop to the wider reflections on philanthropy in higher education that colleagues and I will be sharing over the coming weeks.
Headline numbers
The headline numbers are rather good. The 83 reporting institutions (80 UK, 3 Republic of Ireland) received philanthropic income to the value of £1.3 billion in 2023-24. In the context of the £15.4 billion given by the UK public to all charities1, the tertiary education sector can be rather proud. And there is more to come since the total value of “new funds committed” (the new name for “funds raised”) for the year was even higher at £1.5 billion. A crude measure of return on investment suggests that it has cost no more per pound or euro to raise that money than in 2013-14.
The good news continues: amongst the 65 universities which have taken part in the survey in each year in the last five, the value of new funds committed rose by 54% from £957m to £1.47bn. Even when inflation is taken into account this represents a real terms increase of 27% since 2019-20. One very large gift in the latest year accounts for a few percent of the rise, but this in itself is good news, and the general direction remains the right one.
Top performers are still… well… at the top
It’s been a persistent theme that the Russell Group, which includes Oxford and Cambridge, dominates fundraising success. This year is no exception, with the group (ex-UCL which did not take part this year) reporting 84% of all the new funds committed (up from 83% last year.) Oxbridge accounted for £731m, more than half of all the Russell Group funds raised, with the other 21 universities in the group raising £545m. The remaining 60 universities taking part in the survey raised £243m.
We know that, in general, fundraising success is responsive to extra investment. Those who spend more generally raise more. But even here Oxbridge seems to have the edge. If we compare the overall expenditure on fundraising across the sector2, Oxbridge spend 33% of all the budget while raising 48% of all the money. The rest of the Russell Group raises 36% of the money in return for 37% of the expenditure, while the other 60 raise 16% of the money while spending 30% of the fundraising budget.
Is this disparity inevitable and permanent? We think not. Most Russell Group fundraising operations are well established and have economies of scale: by contrast many others are small, newer or have restarted after hiatus. Fundraising here will almost invariably cost more.
Clustering
Not all Russell Group universities, even beyond Oxbridge, are the same in character or investment in fundraising. These 60 universities range from the very old to the very new and the very small to very large. This is where CASE’s clusters are useful.
For some years CASE has clustered universities together using a statistical model which took into account fundraising performance and a number of other factors. We’ve been sceptical of these recently, and so we are delighted that CASE has revised the groups this year to give greater continuity from year to year and to make comparisons more transparent and more meaningful. We welcome this change, whose rationale is explained fully in the report.
Briefly, the five clusters are as follows:
| Cluster | Median Funds Raised | Number of Fundraising Staff | Number of Universities |
|---|---|---|---|
| Elite | £150m or more | n/a | 2 |
| Advanced | £10m < £150m | n/a | 19 |
| Maturing | £1m < £10m | >=8 | 24 |
| Defined | £1m < £10m | <8 | 17 |
| Initiated | <£1m | n/a | 21 |
We can apply the cluster model to look at what proportion of institutional turnover is spent on advancement, and what proportion of overall turnover comes from philanthropy as a result3.
The Elite group, Oxbridge, spends the highest proportion of its turnover (1.5%) on Advancement. This is more than twice the 0.7% spent by the Advanced group, universities with which Oxbridge has much in common in terms of research profile and academic excellence. It might be argued that Oxbridge has some unique advantages when it comes to fundraising, but the fact is that their philanthropic income as a proportion of turnover is more than five times higher than in the Advanced group (17.8% vs 3.2%).
This makes us want to ask what would the performance of those Advanced universities be like if they, like Oxbridge, had 1.5% of turnover to spend on supporter engagement and fundraising? Would the return on investment drop or increase? Would the greater depth of supporter engagement the extra investment would allow make it more likely that more people would give? Or is the demographic of Oxbridge alumni and supporters so utterly different from the rest that the extra investment would help, but would not enable a complete catch up?
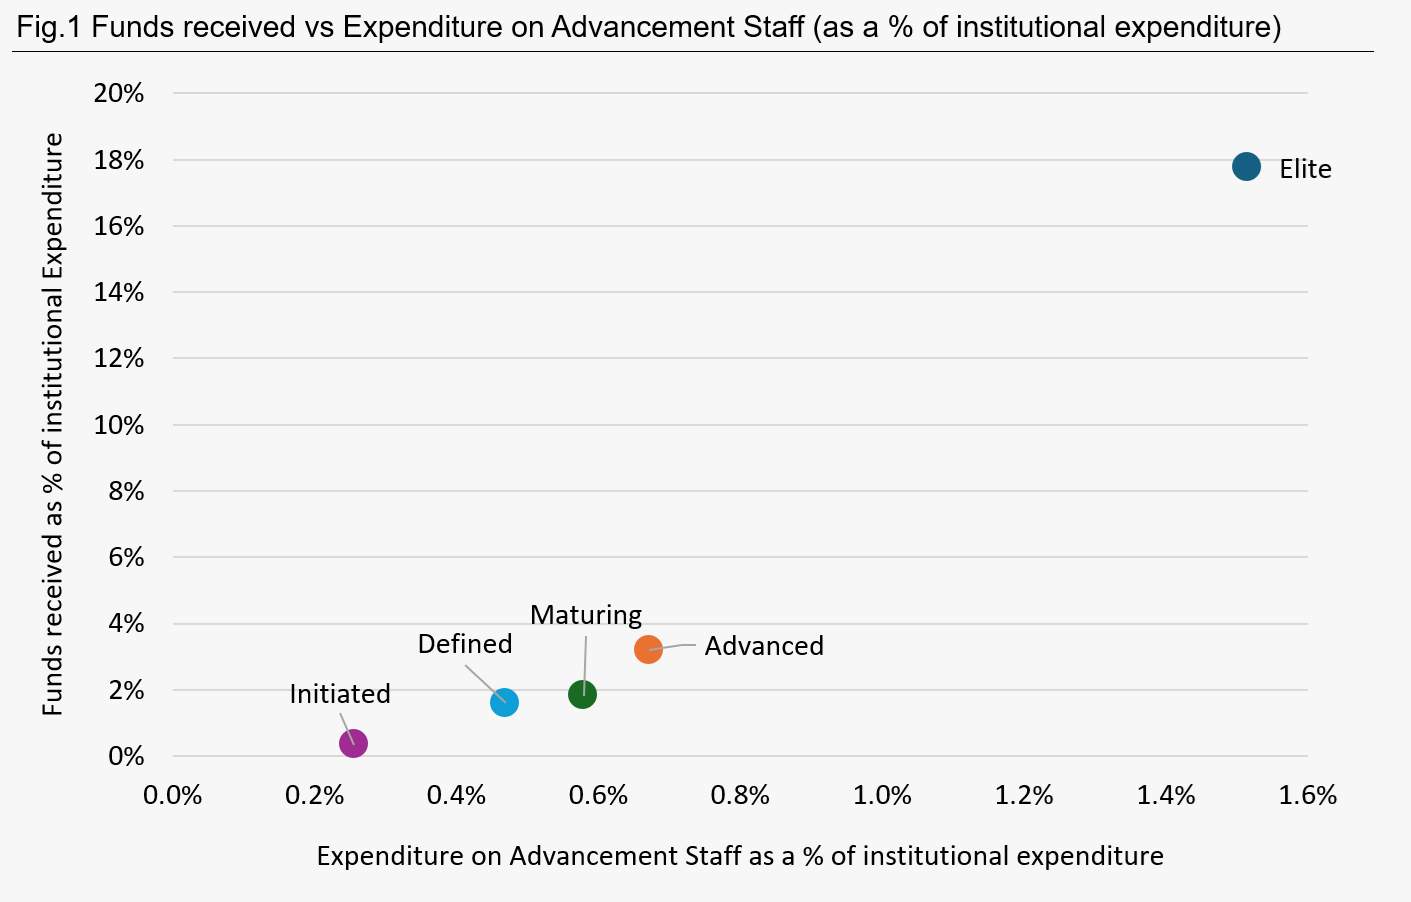
Leaving the Elite group, we see that expenditure as a proportion of turnover for the three middle clusters ranges from 0.47% to 0.67%. But the Advanced group raised twice as much as a proportion of institutional expenditure as the Defined group (3.2% vs 1.6%). The fact that the Maturing group is spending more than the Defined group (0.58% vs 0.48%), while raising only a little more (1.8% vs 1.6%) is perhaps a consequence of the clustering model because the only factor which differs between these groups is staff cohort. They each raise between £1m and £10m, but the Maturing cluster have more staff, so expenditure is higher. But they are also raising more money.
What can we make of this? Institutional Expenditure is, of course, dependent on many factors unrelated to fundraising success. And it could be argued that universities with large and successful medical research programmes or higher research rankings (as have all of the “Advanced” group), might find it easier to raise money as a result. But investment and scale are a factor too, and nowhere is this seen more than in the Initiated group. Many of these have small operations, high expectations, and complex reporting lines to institutional leadership. For many at this stage, the challenge is to build the internal political capital which will allow growth into more consistent operations.
We wonder whether in at least some universities in the Initiated and the Defined groups, the very purpose of the Fundraising function is unclear. This might seem a radical assertion, since the answer is surely obvious? To raise money.
But that’s not the whole answer. For what purpose is the money to be raised, and why? And why now? And why is that university the place to do the thing that needs funding? In a university where fundraised income is contributing less than 2% of overall income it is surely especially necessary for the fundraising office to operate with clear purpose and direction, with boundaries around expectations and with realistic targets. Clarity of purpose would make for greater success, improved institutional confidence and more restful sleep for all concerned.
Donor Numbers and their impact on income streams
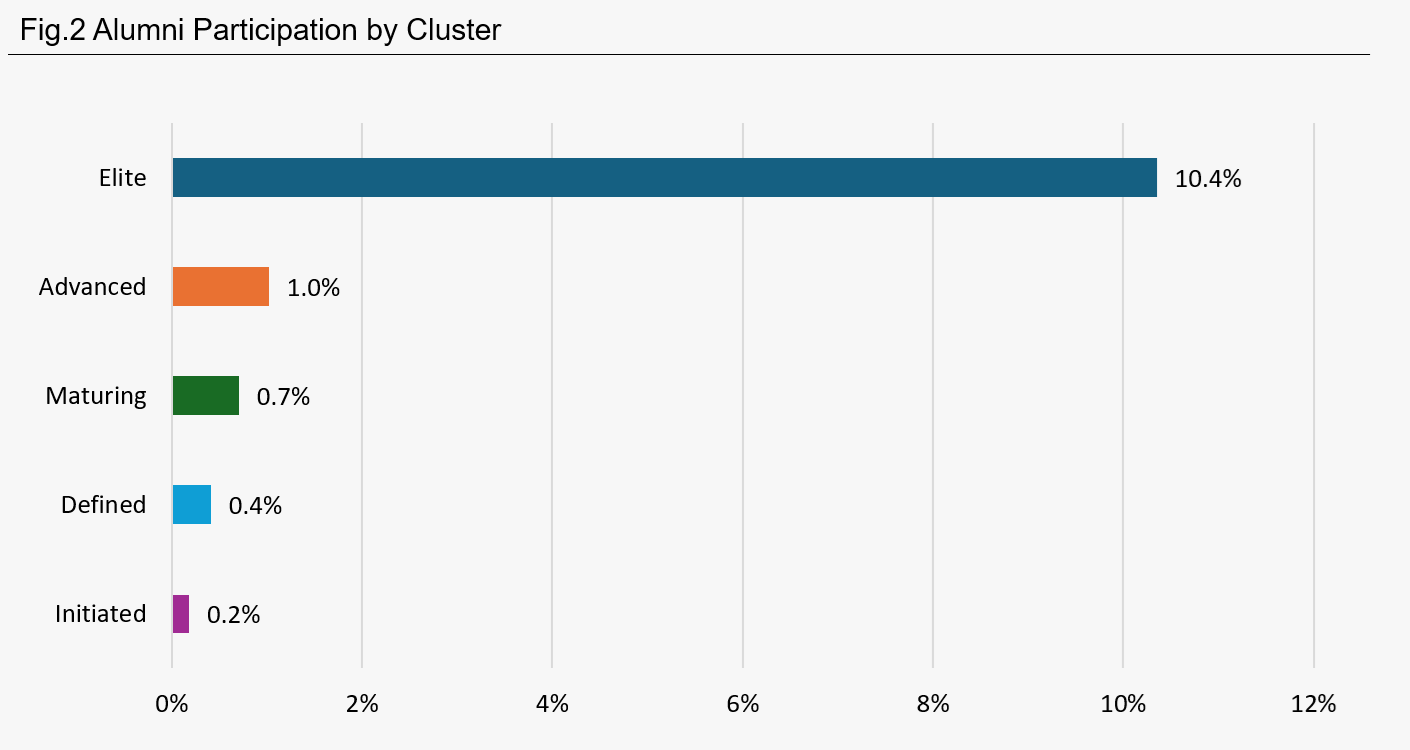
One very noticeable feature of the last few years of CASE Insights reports has been the decline in donor numbers. 82 universities reported 154,400 donors in 2023-24. Not surprisingly, the vast majority of donors are individuals rather than organisations, and three quarters of the individuals are alumni. 80 universities reported 109,573 alumni donors in 2023-24. We estimate that this is down around 32% since 2016-17.
CASE looked at donor numbers in 64 institutions which have reported every year for the last five years. Here we’ve seen a drop in both total and alumni donor numbers of 22% since 2019-20. And just 0.7% of all reported alumni gave to their alma mater in 2023-24. Drilling down a little further we see Oxbridge (estimated number since one university doesn’t report) at more than 10%, but all other universities are at 1% or lower. Arguably, alumni participation is an unhelpful goal in itself, but it can provide a useful comparison between institutions, institution types and over time.
Do donor numbers matter?
Our Insight and Benchmarking work in Regular Giving and more recently in Legacies shows an intimate link between revenue from these two activities. More than 2/3 of realised legacies come from lifetime donors. Our recent study for eight universities showed that a living alum is around 14 times more likely to be active in the legacy pipeline if they are a donor than if they are not. So, as budgets have tightened, alumni numbers have grown and communications have increasingly gone digital, we are worried that older audiences of loyal alumni are being lost as friends, as donors and as future legators.
Legacies
77 universities reported receiving legacies, with an average of 10.4 per institution. It’s perhaps not surprising that the older universities received more legacies since they have more alumni of the dying age. (We do recognise that many post-92 universities are successor institutions to old and venerable technical and professional institutes; but persuading those alumni to put the new institution into their wills is work which few, to our knowledge, have undertaken.) A number of things stand out from the data when we look at it through the lens of the Pearce Report groupings which take into account era of achieving university status:
Non-Oxbridge universities founded before 1960 received a mean of 15 legacies, half that of the single Oxbridge university which reported (we suspect this doesn’t include legacies to its colleges.) The goodwill is there but needs turning into real pledges to give.
Universities founded in the 1960s are receiving legacies, despite the vast majority of their alumni being younger than the average age of death. 46 were left across the 19 universities, and we know that some are very active in their legacy fundraising, storing up a pipeline of income for the future.
The stand-out group in this areas was the Specialists. These institutions were described to me by one of its Vice-Chancellors as “mono-technics.” In reality most teach more than one subject, but these are all in one or two core areas of interest (music, veterinary, fine art etc.) and many are vocational. This hugely increases the likelihood of legacy giving. And indeed the mean number of legacies to this group (35) outstripped even the Oxbridge university which reported its numbers.
The mean legacy income received per legator was £140,000 overall, including Oxbridge, and £75,000 without Oxbridge. 121 legacies in 2023 – 24 were worth more than £100,000 and 10 of these were worth £1m or more. These are big gifts and much larger than the average charity sector legacy.4
We are firmly of the view that this revenue stream has been neglected and should be an area of growth for the sector. Our recent Legacy Insight and Benchmarking project showed one “Advanced” fundraising office routinely receiving one-third of all its individual giving income from legacies, and legacy income at others was in excess of 25%. How can this potential be realised?
Excellent alumni, staff and former staff engagement
Using mass marketing techniques to deliver integrated messaging to donors, alumni, staff and former staff and their respective families
Using one-to-one fundraising techniques to talk with those who “raise a hand” in response to mass marketing
“Gossiping” about legacies, large and small in alumni and other publications
Equipping major gift officers to talk about legacies with existing donors.
Major Gifts
Many universities have invested significant sums in major gift officers, sometimes in central teams and sometimes in faculties or other university departments. The CASE Insights public report is almost entirely silent on everything between mass participation and the very largest gifts although there is some information divided by gift bands in the underlying dataset accessible to participants.
At More, we are considering whether there would be an appetite for a Major Gifts Insight and Benchmarking project similar to our Regular and Legacy projects where we take raw data from a number of institutions, make sure it conforms and can genuinely be compared, and then interrogate it. How long does it take from prospect research to a gift? How many moves? How many Trust gifts are really from individuals? What proportion of major donors start in Regular Giving? (It’s around 40% in our analysis of alumni datasets.) How long do pledges last and what’s the journey to the next gift? And more. Please do get in touch if you’d be interested in being part of a no-obligation workshop to develop these ideas.
The importance of large gifts
There’s no question it’s the very large gifts which make the headlines and on their own, they can achieve a great deal for a university. The report doesn’t disclose the size of the single largest gift to any individual university, but the one made to an Advanced cluster member is enough of an outlier to push the mean largest gift for that group to be twice the median for the same measure. That’s some gift in a group of 19 universities.
There is wide disparity in the sizes of largest gifts to the different clusters (so wide we couldn’t draw a chart.) The median largest new pledge or gift to the Elite group was £74m; to the Advanced £3.7m, Maturing £1.6m, Defined £500k, Initiated £175k. All these gifts will, no doubt, have enabled significant change in their context.
What about large gifts in the Defined and Initiated clusters?
These account for 60% and 75% respectively of all the money raised. Here questions about fundraising portfolios and the like are probably irrelevant. These are likely to be small offices, doing what they can to raise what they can, while building political capital internally to support the notion that philanthropy does have a role to play in the tertiary education funding mix. Our “playbooks” in the Accelerating Ambitions report have plenty of pragmatic advice for these offices.
A fundraising portfolio?
Very large gifts, and especially the ones that are sometimes called “transformational”, are hugely exciting when they come, and usually take an enormous amount of effort. And it’s probably fair to say that they don’t come every year for most universities. For many universities, they fit into a “high risk, high reward, infrequent” category, while at the other end of the spectrum, regular / mass giving fits into a “low risk, lower reward, frequent” category.
We will explore this further in a future blog on the Fundraising Portfolio and how to manage fundraising risk in a similar way to an investment portfolio.
Participation in the survey
CASE notes with regret the declining participation in the survey itself, down to less than half of eligible English and Welsh institutions. CASE is taking steps to address this, and at More we encourage you to take part. We have on occasion helped to complete the CASE return and would be delighted to help you do this if needed.
The results show a sector that continues to grow, adapt and achieve remarkable impact through philanthropy. The stories behind the numbers, from legacies and regular giving to major gifts, point to both opportunities and questions for the years ahead. Over the coming weeks, we’ll share further reflections: my colleagues Rosie Dale and Thom Hipwood will look back on ten years of Regular Giving Insight and Benchmarking, Joanna Motion will also explore how philanthropy can weather today’s storms, and Tim Wells and Nik Miller will bring donor voices into the conversation. Much more to come!
Notes
1 The numbers make a useful comparison but it should be noted that the CASE report measures all giving to UK and Irish universities irrespective of origin, while the CAF one measures giving by the UK public.
2 Allocating half of all Development Services costs to fundraising
3 We recognise the return on investment on money spent in year may well take some years to be fully realised, but year on year comparisons remain valid in groups whose behaviour does not change very quickly.
4 It’s worth noting that a quirk of the CASE reporting rules means that if someone leaves a property to a University, this is not counted as a legacy, but as a gift in kind once it’s sold. So the numbers above under-state the actual income received from this revenue stream.